
Log Aquifer Properties with Depth
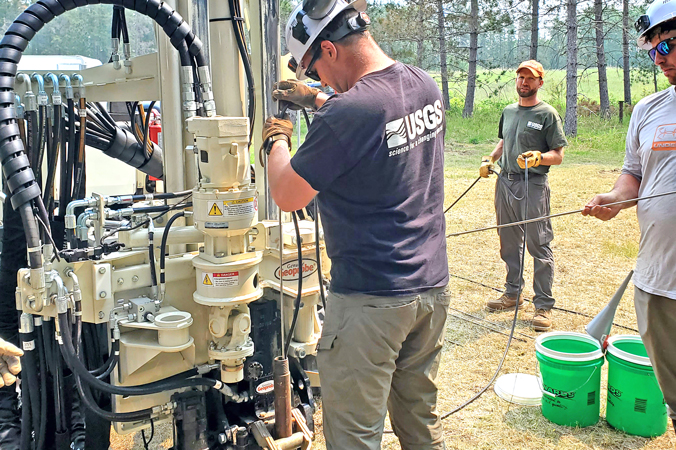
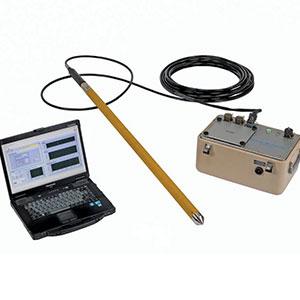
The NMR (nuclear magnetic resonance) is a direct push logging tool used to measure aquifer characteristics such as water content, porosity and relative pore size. The tool uses powerful magnetic fields to affect the hydrogen nucleus of the water molecules causing them to generate an electromagnetic signal for direct characterization. The magnitude of the initial signal is directly proportional to the amount of water within the pore space and the signal decay rate is strongly influenced by the pore size of the formation. This can be used to estimate critical properties governing flow and storage of groundwater, such as aquifer porosity and permeability in fully saturated formations. Additionally, this information can be used within calculations of contaminate mass flux and geotechnical bulk density loading.
= Tool String Diagram (TSD)
NMR Overview
What is Geoprobe® Direct Image® NMR?
- Provides a direct measurement of aquifer water content and porosity
- Estimate of pore size distribution
- NMR relaxation times
- Mobile, capillary and clay-bound water fractions
- Two model estimates of hydraulic conductivity: Schlumberger-Doll research and sum-of-echos equations
- Hydraulic conductivity estimates an order of magnitude above and below what the HPT model allows
- Can be operated through predrilled 2.25in casings or as its own push only CPT-NMR tool
- Borings are logged upon tool retraction in the "uplogging" mode
- Used within environmental and geotechnical investigations
The NMR system, developed by Vista Clara Inc. and modified in partnership with Geoprobe Systems for application via direct push (DP) technologies. Geoprobe Systems is the official distributor of DP NMR for North America, Central America and Colombia.
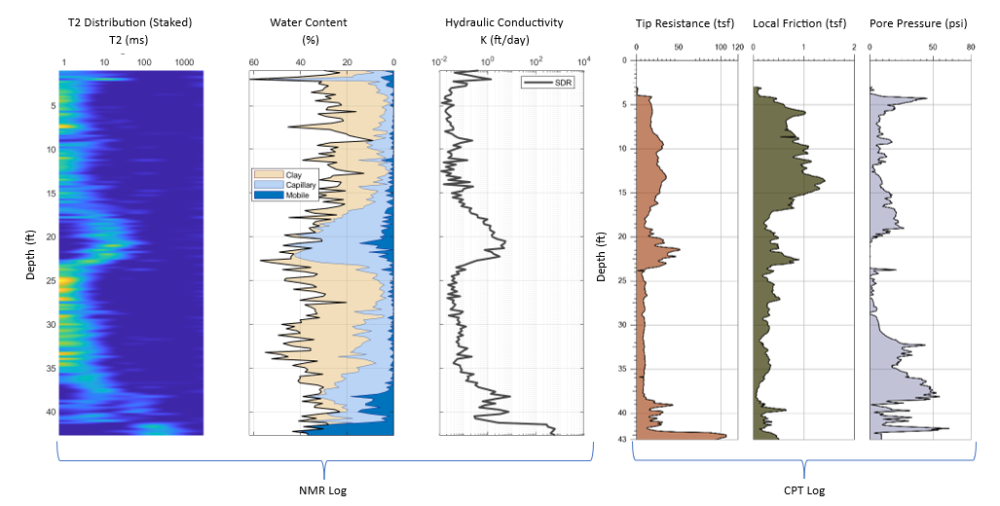
Typical NMR Log with CPT:
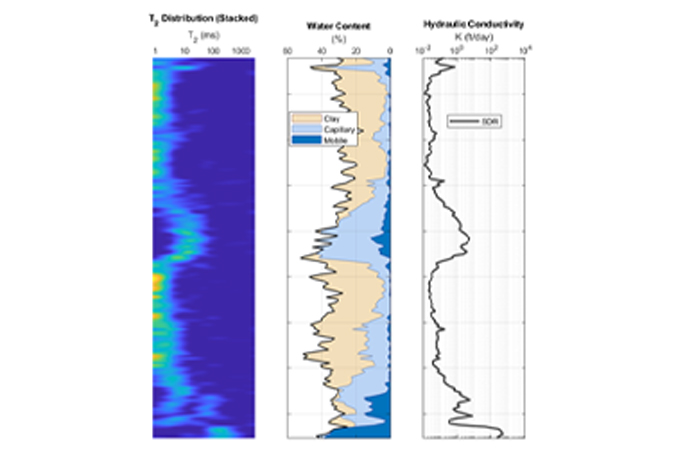
Graphs (left to right) NMR Log: T2 distribution, Water content % made up of Clay, Capillary or Mobile porosity, Hydraulic Conductivity (K-SDR). CPT: Tip Resistance, Local Friction, Pore Pressure
Principles of Operation
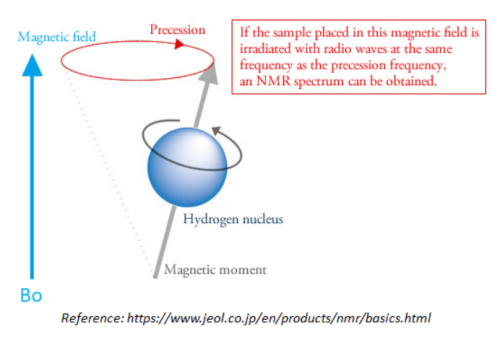
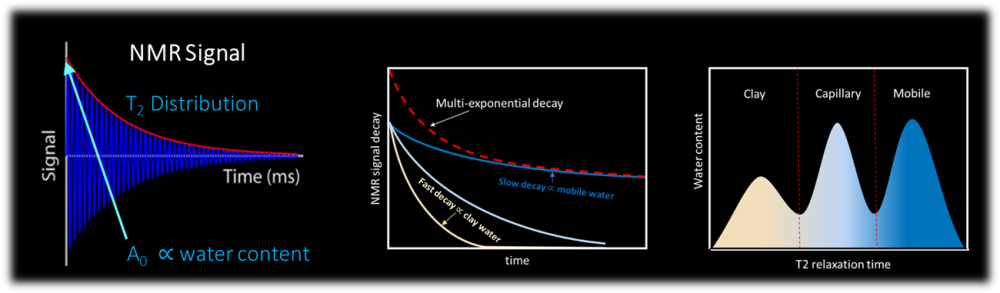
A hydrogen proton is a spinning particle with a positive charge; thus, it has a magnetic moment to it. In general, NMR measurements are conducted in the presence of magnetic fields and the tool analyzes the response of hydrogen spins to magnetic field perturbation.
Within geophysical applications of NMR, hydrogen protons in water molecules are first aligned in phase to a static magnetic field (Bo) generated by strong magnets within the tool. A high voltage electrical current is pulsed through a coil of shielded wire, located within the tool, to produce an electromagnetic (EM) signal at the resonant (Larmor) frequency of hydrogen nuclei. This current pulse excites the nuclei, causing them to tip out of alignment and precesses (wobble) about the magnetic field. As the nuclei precesses they generate their own EM signal, or echo, which is measured and recorded by the wire coils within the tool.
A series of pulses are done to measure a spin echo train of the decaying hydrogen nuclei signal. The initial amplitude (Ao) of the signal is directly proportional to the amount of hydrogen nuclei (e.g. water) in the adjacent formation, and a percent water content can be calculated (the tool is calibrated to 100% water content). Furthermore, the rate of the signal decay is primarily determined by pore size and soil particle interactions. Quicker decay rates indicate greater amounts of fine grain particles or clay bound water whereas longer decay rates indicate coarser grain sediments with mobile water such as a sandy aquifer. The data can be used to determine the distribution of decay rates, known as the T2 distribution, and identify bound, capillary, and mobile fractions of the water content.
T2 Distribution Interpretation
In the image below, the spin echo decay graph on the upper right is the raw data from 32ft on the T2 distribution graph on the left which is indicated by the red line. You can observe the slope of the spin echo decay (raw data) and the decay rate (time) of the NMR signal. The T2 distribution and mobile/capillary/clay bound % water content is derived from the spin echo decay data. These graphs are available for every measurement interval within the NMR logs.
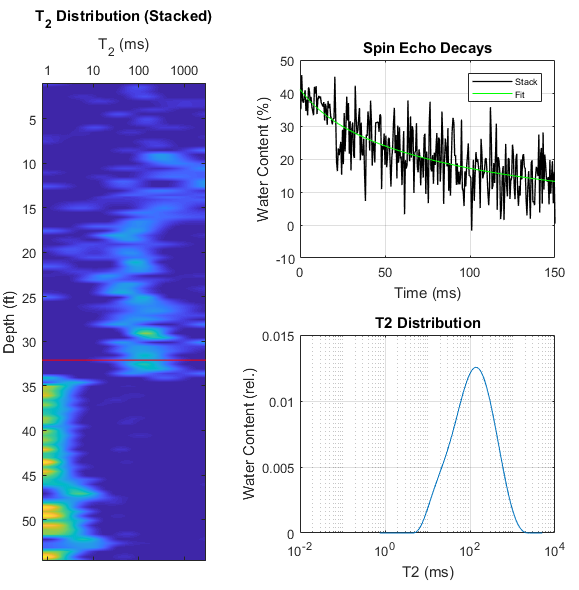
T2 Distribution from 32ft
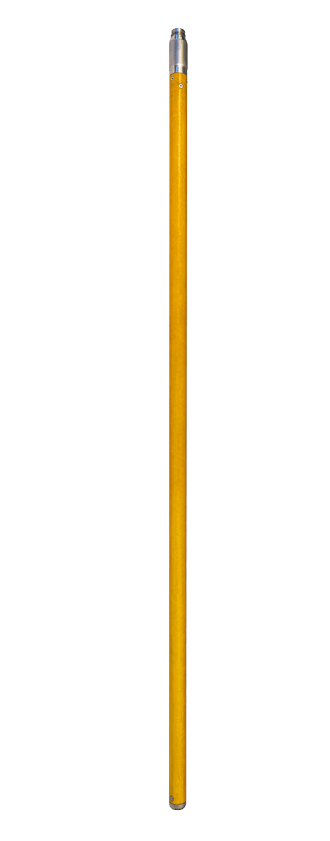
The Dart™ DP140N probe makes its measurements in 5.5 and 6in diameter shells around the probe’s magnetic coil zone. These shell diameters are determined by the different frequencies that being measured. This puts the measurement zone outside of the 2.25in impact zone of the drive rods into undisturbed formation.
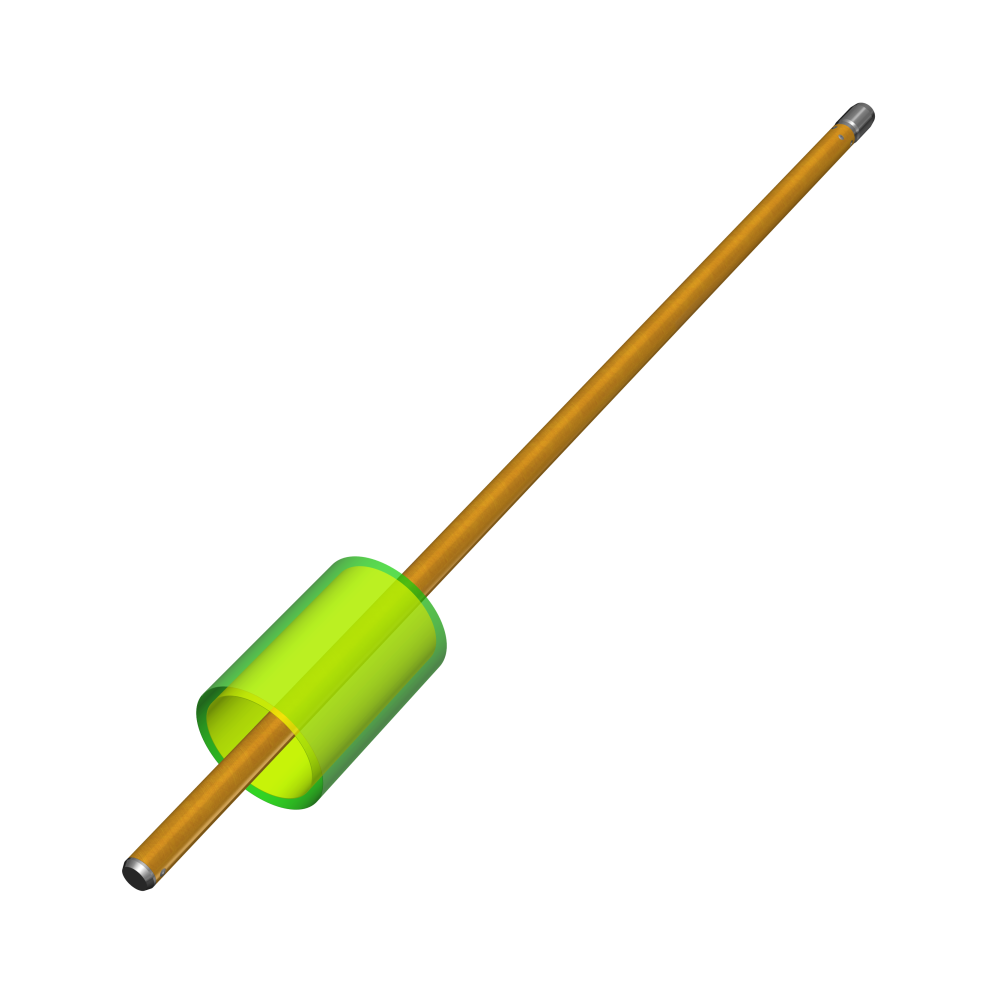
Dart™ DP140N probe
Example Logs
NMR logs provide valuable insight into the aquifer characteristics of water content and porosity. The T2 distribution readings are primarily controlled by the soil pore size of the measured formation.
The NMR logs below show T2 Distribution, % Water Content as Mobile, Capillary or Clay Bound, Hydraulic Conductivity (K) - two models - SDR and SOE, and residual noise on both frequencies and when they are stacked. For the highest quality data, residual noise of frequency should be below the recommended 20%. If one frequency shows a higher noise level the lower noise frequency will be weighted heavier within the stacked data. T2 distribution values, water content and noise levels are measured during logging operations. The mobile, capillary and clay bound water and hydraulic conductivity values are inferred immediately upon processing the T2 data during the logging operation and are able to be viewed shortly after the data has been collected.
The first log shown below has noise levels well below the 20% recommended maximum. The second log below has slightly higher noise readings with the frequency 1 channel being significantly higher than the 20% maximum. As you can see, frequency 2 is mostly below the 20% maximum noise level and the stacked value holds very close to frequency 2 in this log. The majority of the data is being used from that frequency.
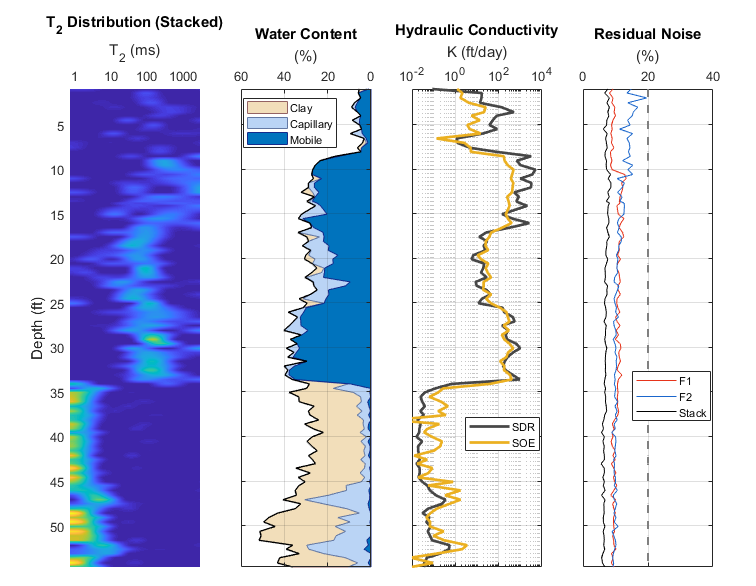
An NMR log includes (from left to right) T2 distribution, Water Content in mobile/capillary or clay bound formation, Hydraulic conductivity (K) (SDR & SOE), & Residual Noise % by frequency. The NMR log shows much longer T2 distributions in the 0-34ft range indicative of larger grain/large pore size. The bright colored short T2 readings below 34ft indicate saturated clay bound water. The water table is well defined in this log with the water content jump at about 9ft from <10% to 30% water content.
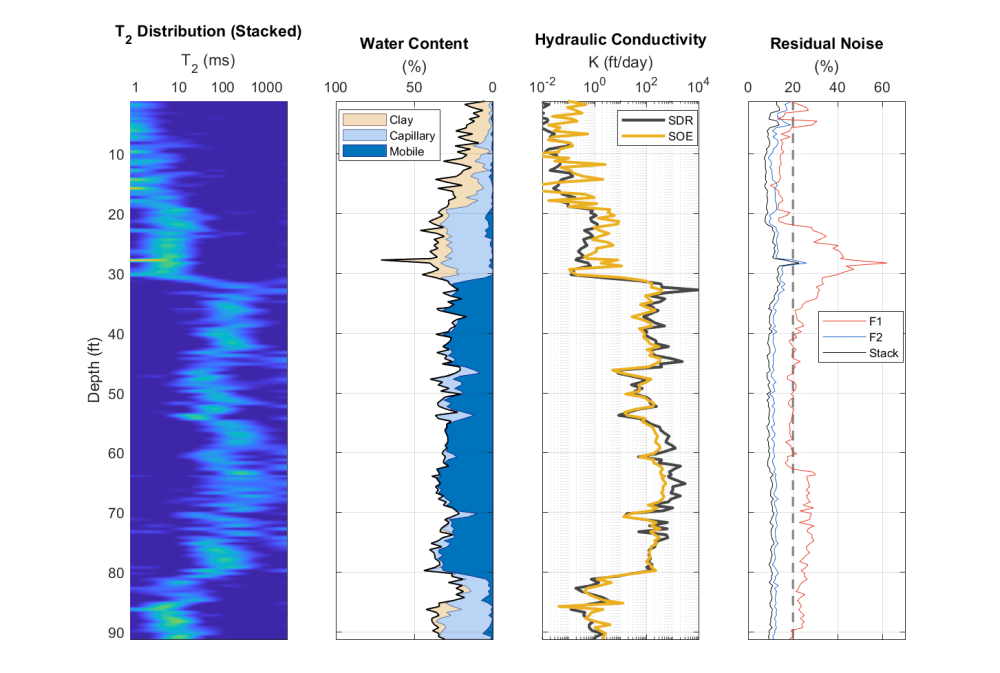
An NMR log includes (from left to right) T2 distribution, % Water Content in mobile/capillary or clay bound formation, Hydraulic conductivity (K (SDR & SOE), Residual Noise % by frequency. Shorter T2 values in the top 30ft indicate clay/silt clay soils with a water table likely around 20ft where the water content rises to nearly 40%. Below 30ft we see much longer T2 values due to large pore space soils indicative of a sandy aquifer. At around 80ft the T2 values shorten with fine grain soils.
Features & Options
What is Geoprobe® Direct Image® NMR?
- Provides a direct measurement of aquifer water content and porosity
- Estimate of pore size distribution
- NMR relaxation times
- Mobile, capillary and clay-bound water fractions
- Two model estimates of hydraulic conductivity: Schlumberger-Doll research and sum-of-echos equations
- Hydraulic conductivity estimates an order of magnitude above and below what the HPT model allows
- Can be operated through predrilled 2.25in casings or as its own push only CPT-NMR tool
- Borings are logged upon tool retraction in the "uplogging" mode
- Used within environmental and geotechnical investigations
The NMR system, developed by Vista Clara Inc. and modified in partnership with Geoprobe Systems for application via direct push (DP) technologies. Geoprobe Systems is the official distributor of DP NMR for North America, Central America and Colombia.
Typical NMR Log with CPT:
Graphs (left to right) NMR Log: T2 distribution, Water content % made up of Clay, Capillary or Mobile porosity, Hydraulic Conductivity (K-SDR). CPT: Tip Resistance, Local Friction, Pore Pressure
A hydrogen proton is a spinning particle with a positive charge; thus, it has a magnetic moment to it. In general, NMR measurements are conducted in the presence of magnetic fields and the tool analyzes the response of hydrogen spins to magnetic field perturbation.
Within geophysical applications of NMR, hydrogen protons in water molecules are first aligned in phase to a static magnetic field (Bo) generated by strong magnets within the tool. A high voltage electrical current is pulsed through a coil of shielded wire, located within the tool, to produce an electromagnetic (EM) signal at the resonant (Larmor) frequency of hydrogen nuclei. This current pulse excites the nuclei, causing them to tip out of alignment and precesses (wobble) about the magnetic field. As the nuclei precesses they generate their own EM signal, or echo, which is measured and recorded by the wire coils within the tool.
A series of pulses are done to measure a spin echo train of the decaying hydrogen nuclei signal. The initial amplitude (Ao) of the signal is directly proportional to the amount of hydrogen nuclei (e.g. water) in the adjacent formation, and a percent water content can be calculated (the tool is calibrated to 100% water content). Furthermore, the rate of the signal decay is primarily determined by pore size and soil particle interactions. Quicker decay rates indicate greater amounts of fine grain particles or clay bound water whereas longer decay rates indicate coarser grain sediments with mobile water such as a sandy aquifer. The data can be used to determine the distribution of decay rates, known as the T2 distribution, and identify bound, capillary, and mobile fractions of the water content.
T2 Distribution Interpretation
In the image below, the spin echo decay graph on the upper right is the raw data from 32ft on the T2 distribution graph on the left which is indicated by the red line. You can observe the slope of the spin echo decay (raw data) and the decay rate (time) of the NMR signal. The T2 distribution and mobile/capillary/clay bound % water content is derived from the spin echo decay data. These graphs are available for every measurement interval within the NMR logs.
T2 Distribution from 32ft
The Dart™ DP140N probe makes its measurements in 5.5 and 6in diameter shells around the probe’s magnetic coil zone. These shell diameters are determined by the different frequencies that being measured. This puts the measurement zone outside of the 2.25in impact zone of the drive rods into undisturbed formation.
Dart™ DP140N probe
NMR logs provide valuable insight into the aquifer characteristics of water content and porosity. The T2 distribution readings are primarily controlled by the soil pore size of the measured formation.
The NMR logs below show T2 Distribution, % Water Content as Mobile, Capillary or Clay Bound, Hydraulic Conductivity (K) - two models - SDR and SOE, and residual noise on both frequencies and when they are stacked. For the highest quality data, residual noise of frequency should be below the recommended 20%. If one frequency shows a higher noise level the lower noise frequency will be weighted heavier within the stacked data. T2 distribution values, water content and noise levels are measured during logging operations. The mobile, capillary and clay bound water and hydraulic conductivity values are inferred immediately upon processing the T2 data during the logging operation and are able to be viewed shortly after the data has been collected.
The first log shown below has noise levels well below the 20% recommended maximum. The second log below has slightly higher noise readings with the frequency 1 channel being significantly higher than the 20% maximum. As you can see, frequency 2 is mostly below the 20% maximum noise level and the stacked value holds very close to frequency 2 in this log. The majority of the data is being used from that frequency.
An NMR log includes (from left to right) T2 distribution, Water Content in mobile/capillary or clay bound formation, Hydraulic conductivity (K) (SDR & SOE), & Residual Noise % by frequency. The NMR log shows much longer T2 distributions in the 0-34ft range indicative of larger grain/large pore size. The bright colored short T2 readings below 34ft indicate saturated clay bound water. The water table is well defined in this log with the water content jump at about 9ft from <10% to 30% water content.
An NMR log includes (from left to right) T2 distribution, % Water Content in mobile/capillary or clay bound formation, Hydraulic conductivity (K (SDR & SOE), Residual Noise % by frequency. Shorter T2 values in the top 30ft indicate clay/silt clay soils with a water table likely around 20ft where the water content rises to nearly 40%. Below 30ft we see much longer T2 values due to large pore space soils indicative of a sandy aquifer. At around 80ft the T2 values shorten with fine grain soils.
Videos
Resources
Click on a section below to view information.

Nuclear Magnetic Resonance (NMR), a widely used borehole wireline logging technology in the petroleum industry for characterizing hydrocarbon reservoirs, has been adapted for hydrological investigations within monitoring wells and open boreholes. During t
ID: 13423 | Date:

Depend on Team Geoprobe®
Since 1987, Geoprobe® has manufactured innovative drilling rigs and tooling - engineered for efficiency and safety - simplifying drillers’ jobs and empowering their companies to succeed as productive and profitable leaders in the industry. When you partner with Geoprobe® you receive:
Customer-inspired Innovation
Engineering and building industry-leading drilling rigs, tooling, and techniques for the technical driller based on your needs to work safer and more efficiently.
Exceptional Value
Ensuring drilling rigs and tooling are created in conjunction – with consistent quality – to collect the highest-quality information with the most accurate result to get you to, into, and through the job efficiently.
Superior Service
Equipping you to do your best job and keeping you in the field via one-on-one expert sales and service technicians manning live support phone lines, shipping necessary parts same-day.
What is Geoprobe® Direct Image® NMR?
- Provides a direct measurement of aquifer water content and porosity
- Estimate of pore size distribution
- NMR relaxation times
- Mobile, capillary and clay-bound water fractions
- Two model estimates of hydraulic conductivity: Schlumberger-Doll research and sum-of-echos equations
- Hydraulic conductivity estimates an order of magnitude above and below what the HPT model allows
- Can be operated through predrilled 2.25in casings or as its own push only CPT-NMR tool
- Borings are logged upon tool retraction in the "uplogging" mode
- Used within environmental and geotechnical investigations
The NMR system, developed by Vista Clara Inc. and modified in partnership with Geoprobe Systems for application via direct push (DP) technologies. Geoprobe Systems is the official distributor of DP NMR for North America, Central America and Colombia.
Typical NMR Log with CPT: Graphs (left to right) NMR Log: T2 distribution, Water content % made up of Clay, Capillary or Mobile porosity, Hydraulic Conductivity (K-SDR). CPT: Tip Resistance, Local Friction, Pore Pressure
:
:
:
A hydrogen proton is a spinning particle with a positive charge; thus, it has a magnetic moment to it. In general, NMR measurements are conducted in the presence of magnetic fields and the tool analyzes the response of hydrogen spins to magnetic field perturbation.
Within geophysical applications of NMR, hydrogen protons in water molecules are first aligned in phase to a static magnetic field (Bo) generated by strong magnets within the tool. A high voltage electrical current is pulsed through a coil of shielded wire, located within the tool, to produce an electromagnetic (EM) signal at the resonant (Larmor) frequency of hydrogen nuclei. This current pulse excites the nuclei, causing them to tip out of alignment and precesses (wobble) about the magnetic field. As the nuclei precesses they generate their own EM signal, or echo, which is measured and recorded by the wire coils within the tool.
A series of pulses are done to measure a spin echo train of the decaying hydrogen nuclei signal. The initial amplitude (Ao) of the signal is directly proportional to the amount of hydrogen nuclei (e.g. water) in the adjacent formation, and a percent water content can be calculated (the tool is calibrated to 100% water content). Furthermore, the rate of the signal decay is primarily determined by pore size and soil particle interactions. Quicker decay rates indicate greater amounts of fine grain particles or clay bound water whereas longer decay rates indicate coarser grain sediments with mobile water such as a sandy aquifer. The data can be used to determine the distribution of decay rates, known as the T2 distribution, and identify bound, capillary, and mobile fractions of the water content.
: T2 Distribution Interpretation
In the image below, the spin echo decay graph on the upper right is the raw data from 32ft on the T2 distribution graph on the left which is indicated by the red line. You can observe the slope of the spin echo decay (raw data) and the decay rate (time) of the NMR signal. The T2 distribution and mobile/capillary/clay bound % water content is derived from the spin echo decay data. These graphs are available for every measurement interval within the NMR logs.
: T2 Distribution from 32ft
The Dart™ DP140N probe makes its measurements in 5.5 and 6in diameter shells around the probe’s magnetic coil zone. These shell diameters are determined by the different frequencies that being measured. This puts the measurement zone outside of the 2.25in impact zone of the drive rods into undisturbed formation.
: Dart™ DP140N probe
:
NMR logs provide valuable insight into the aquifer characteristics of water content and porosity. The T2 distribution readings are primarily controlled by the soil pore size of the measured formation.
The NMR logs below show T2 Distribution, % Water Content as Mobile, Capillary or Clay Bound, Hydraulic Conductivity (K) - two models - SDR and SOE, and residual noise on both frequencies and when they are stacked. For the highest quality data, residual noise of frequency should be below the recommended 20%. If one frequency shows a higher noise level the lower noise frequency will be weighted heavier within the stacked data. T2 distribution values, water content and noise levels are measured during logging operations. The mobile, capillary and clay bound water and hydraulic conductivity values are inferred immediately upon processing the T2 data during the logging operation and are able to be viewed shortly after the data has been collected.
The first log shown below has noise levels well below the 20% recommended maximum. The second log below has slightly higher noise readings with the frequency 1 channel being significantly higher than the 20% maximum. As you can see, frequency 2 is mostly below the 20% maximum noise level and the stacked value holds very close to frequency 2 in this log. The majority of the data is being used from that frequency.
: An NMR log includes (from left to right) T2 distribution, Water Content in mobile/capillary or clay bound formation, Hydraulic conductivity (K) (SDR & SOE), & Residual Noise % by frequency. The NMR log shows much longer T2 distributions in the 0-34ft range indicative of larger grain/large pore size. The bright colored short T2 readings below 34ft indicate saturated clay bound water. The water table is well defined in this log with the water content jump at about 9ft from <10% to 30% water content.
: An NMR log includes (from left to right) T2 distribution, % Water Content in mobile/capillary or clay bound formation, Hydraulic conductivity (K (SDR & SOE), Residual Noise % by frequency. Shorter T2 values in the top 30ft indicate clay/silt clay soils with a water table likely around 20ft where the water content rises to nearly 40%. Below 30ft we see much longer T2 values due to large pore space soils indicative of a sandy aquifer. At around 80ft the T2 values shorten with fine grain soils.
:
: